Mon 02 March 2015
This year I'm starting to delve into some electronics projects and hardware hacking.
What follows is an account of my first end-to-end Raspberry Pi project.
In terms of functionality, it doesn't do much at the moment - just reads from
a photoresistor sensor and plots the light levels in the corner of my office. Eventually,
I want to hook up a couple of light, moisture and temperature sensors throughout
my garden to do some science experiments and/or remind myself to water
the tomatoes. This is but the first step
in that larger project...
-
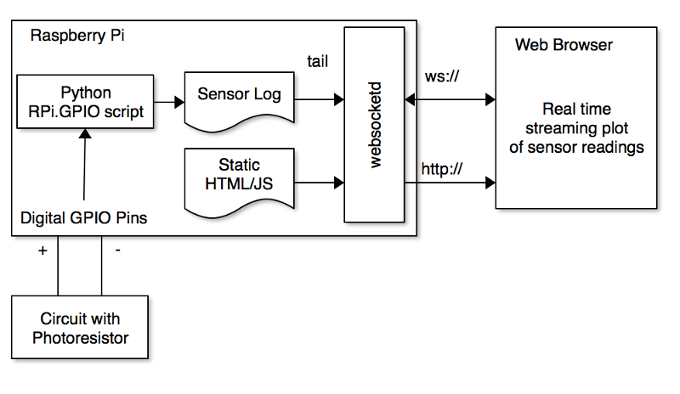
The Pi is wired up to a 3.3v circuit with a photoresistor.
-
The state of the digital input pins are read by a python program.
-
The readings are streamed to a websocket via log file.
-
The HTML/Javascript interface connects with the websocket and plots the values in real time.

Although it's all just for fun at this point, I've discovered a lot of great unix networking
tools and javascript libraries
that will come in handy in my day job as well. Here's the details on how it all came together...
The circuit
I implemented the design
from the adafruit tutorial on the subject. The adafruit
image shows the basic idea:

The photoresistor provides increased resistance to electric current as the visible light becomes dimmer. Conversely, resistance decreases as light becomes brighter. It is an analog sensor but
the Raspberry Pi only has digital inputs (the general purpose input output or GPIO pins).
To solve that, we can employ a capacitor using "RC timing".
A capacitor builds up voltage
over time and, when this voltage hits ~1.4V, the digital input pin reads "high". So
instead of taking a direct analog reading, we set a loop and time how long it
takes for the capacitor to "fill up".
If the time interval is small (i.e. the capacitor is charging rapidly), there
is less resistance from our analog sensor which means more light. If the time
interval is large (i.e. the capacitor is taking a long time to charge on each cycle),
there is more resistance and less light.
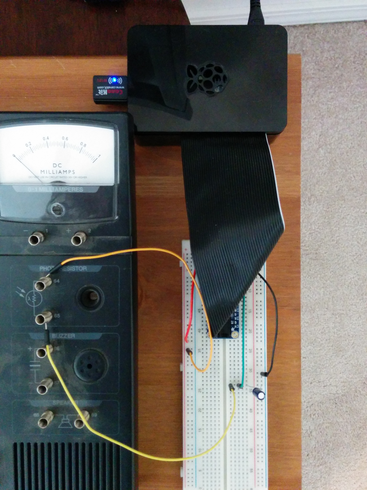
Wired up to the photoresistor on my 25 year-old Radio Shack Electronics Learning Lab,
it looks a bit clunkier but still does the trick:

Quick side note: The ribbon and connectors between the raspberry pi and the breadboard are called
a Pi Cobber. It makes working with the
GPIO pins easier but, as you can tell from the photos, the incoming cable obstructs access a bit.
I might take a look at the T-Cobbler
which promises to clear up some vertical space on the breadboard.
Reading digital input pins from an analog sensor
In order to read input from our analog pins, we can use the RPi.GPIO python library.
There's not much more that I can add to the adafruit tutorial which covers the topic well. I made a few modifications:
- output a unix timestamp along with the reading
- flush the output to
stdout after every reading to make sure the output isn't buffered.
if __name__ == "__main__":

    while True:
         # Get sensor timing and unix timestamp
         reading = RCtime(18)
         n = datetime.datetime.now()
         timestamp = to_unix_timestamp(n)

         print "{},{}".format(timestamp, reading)
         sys.stdout.flush()
You can read the complete read_sensor.py script on github.
With the script in place and the circuit wired up, I can fire up the script
sudo python read_sensor.py
and see the timestamp and sensor reading written to the console as comma-separated values:
1425505117.05,793
1425505117.16,802
1425505117.38,768
1425505117.82,709
1425505117.93,801
1425505118.05,798
So what do those values mean? They represent a count of the number of cycles it took to
charge the capacitor. Not a meaningful number by itself but it could be calibrated to
use standard units or simply used as relative values (lower value == brighter light)
It's important to note that, on a Linux machine, you can't be guaranteed that your
event loop won't get interrupted by other processes. So you probably shouldn't use Linux
as a real-time sensor platform directly. However, it works well enough for demonstration
provided your Raspberry Pi isn't bogged down by other CPU-intensive processes.
Another caveat with this approach - we can only use a single process to access the GPIO
pins in this manner. Having multiple processes or threads setting/reading GPIO pin states
would cause inaccuracies as each process could reset the pins mid-cycle and interrupt
the timing of other processes.
Streaming websockets
Websockets are an extension to HTTP that allow data to be sent from a server to a client
using a persistent connection. Think pushing notification messages.
websocketd allows you to
take the standard output from any unix program and publish it on a
websocket. It can also work with standard input, opening up the doors for some
amazing software workflows: imagine taking any well behaved Unix command and immediately
wrapping it's functionality in a web protocol!
To output the sensor readings using a websocket, I'll first run the read_sensor.py script in the background with high priority (nice -20) and redirect the output to a logfile:
sudo nice -20 python read_sensor.py > log.txt &
Then I will run websocketd on port 8080, serve a few static
files and provide a command to run.
In this case, the command is the basic unix tail -f which streams the contents of the log file.
websocketd --port=8080 --staticdir=./static tail -f log.txt
Now the sensor readings are being logged and a websocket server is running.
For each client that connects to the websocket, a new process (tail -f log.txt) will be started
and stdout will be streamed to that client via websocket messages.
Note that the tail -f command is not yet running until a websocket client makes a
connection. Because it runs in its own process and simply reads the sensor log file,
we can start as many of them as our hardware can handle.
In summary, the pattern is: run a single process that reads from the GPIO pins and writes to a sensor log, then fire off multiple processes that read the log and stream the output over websockets.
Now we're ready to test it.
HTML/Javascript interface
Working with websockets in Javascript is fairly straightforward. First, create a connection
var ws = new WebSocket('ws://example.org:8080/');
then set some callbacks to handle incoming messages from the server.
ws.onmessage = function(e){
   console.log("We got something:", e.data);
}
Websockets are built into almost every modern browser so this functionality
works out of the box. But if the connection is lost for any reason, the native Websocket
implementations do not automatically reconnect. To solve that problem,
there is ReconnectingWebSocket which does exactly what it sounds like; attempts to
reconnect automatically when needed.
Then to create an animated real time plot of the streaming data, you'll need a javascript library like Smoothie Charts.
I should also note that the server (websocketd), the javascript plotting library (Smoothie Charts), and the javascript networking library (ReconnectingWebSocket) were all written by joewalnes - this guy is responsible for making the three biggest pieces of this system and deserves mad props!
All of the HTML and js can be found here: index.html.
Finally, here is the result. A streaming, real time plot of sensor readings. This clip was recorded as I came into my office, opened a few
windows and turned on a light. As the room gets brighter, you can see the sensor readings drop, and then rise again as I pass my hand over sensor a few times to block the light.
Maybe not incredibly useful in it's current state but it provided an excellent learning experience to work on the entire stack, integrating electronics and hardware with web software. It opens the doors for all sorts of new projects. All of the code is available on my github repo. Any questions? Shoot me an email or message on twitter. I'm a beginner when it comes to electrical theory so somebody please correct me if I'm way off the mark on something.